
Wednesday, June 30, 2010
CBA : 5 waves completing. Play the 3 waves up.

CBA : Completing 5 Waves. Just by Elliot Waves principles 5 impulse and 3 corrective waves to follow.
AXA : Update 010710

Monthly chart. For perspective not trading. Prices seem sto be out of the red support line. $5.00 may still be reached to close off the gap on the weekly chart as well. However, stochs on daily chart has rise from O/S levels. Maybe a bounce, a correction. Weekly stochs as per previous post is in consolidation near O/S levels. A base maybe forming. However volatility in weekly prices may be wide and may cover $5.00. Be watchful and let the stop be the stop.


Tuesday, June 29, 2010
AXA : Chart Update 30/06/10


Looks like AXA looking for support. Weekly charts seems to show Bullish divergence between Prices and stochs. On the daily chart, stochs is trading at the outer band of the O/S levels. Dow had plunge 268pts overnight most stocks had gaped down, AXA, no difference, had opened lower but not making new low though. But keep in mind the large gap up the past weeks which if its closed prices will have to come down to $4.90. But if support hold here and prices is already at O/S levels, prices may make new high from here.
Tuesday, June 22, 2010

AXA : Weekly Chart Update

AXA : possible covering of gap. Support at $5.50. POssible doable target $4.75. Support line of the descending triangle and it would have covered the gap. $4.25, aggressive target, corresponding to a steeper descending triangle.

Monday, June 21, 2010

Thursday, June 17, 2010

Wesfarmers : WES : Update.

$29.50 is critical. Must hold.

Weekly chart showing the consolidation. Will it break higher or lower ??
SUL : SuperCheap Auto. : Wave 5??


Monthly and Weekly charts shows prices in a triangular consolidation. However daily prices seems to have stalled. Stochs is actually at extreme o/b levels. See if it will pull back. Watch price action before proceeding further.
QAN : Update

Weekly Chart

Daily Chart
Weekly stochs rising while prices supported at $2.40 to $2.45. Stay in touch for continuation of trend downwards. wait for confirmation while prices moving sideways. Was a good move to have taken profit earlier on the bullish price/stochs divergence on the hourly chart.
Wednesday, June 16, 2010


Handling paper profit
--------------------
We are human & are tempted to take profits albeit prematurely. We know
that prices has not reached our target based on the trade setup, but
the paper profit looks to juicy and nice and we fall into the
temptation to pluck the forbidden fruit and maybe kill the golden
goose as well. One way not to kill the golden goose is to see goose as
half a goose. Mentally half the profit and put a trailing stop.

Tuesday, June 15, 2010


Trade Ideas
Trade Ideas :
1. WES :Continue to watch Wesfarmers : Ready to short if resistance at $29.00 holds
2. IRE : Weekly triangilar consolidation, daily : wave 1 topped. Get in on Wave 2 @ $8.75
3. RIO : Look to short at $72.50 - $72.00
4. AXA : Consoildating, watch for breakout either way.[3-5days]
5. Tol : Probably can look to short if resistance hold at $6.00 thereabouts.
6. GDO : Consolidating at a low. Bottoming triangle. Incubabtion prospect.


FMG

Wave C in progress. If Wave C=A=$1.00. Wave C target = $1.00 + 3.80 = $4.80 which is also the top of the trend channel.
Tol : Toll Holdings. Profit downgrade . Prices ??

Prices may continue south after a short rebound. No trade to the upside. Maybe choppy, too many MAs and trend channel resistance. Lousy Risk/reward ratio. No trade. Monitor to short.
QAN : Exit

Hourly stochs showing bullish divergence. Higher Low on stochs against lower low on prices. Prices making lower low but stochs make higher low. Exited position. Continue to monitor to sell at higher prices. Beware the trend line channel.
Monday, June 14, 2010


Sunday, June 13, 2010
TSE : Transfield Services.


5th Wave down ? in the early stages. Probably a small rebound of the current wave. Look to short when its higher.
COH : Cochlear : Wave 5 ?


Wave 5 in process. ? Take note of the stochs which is testing another o/b extreme.
Resistance at $77.
Wesfarmers : WES

Prefered count.

Alternative count. But take note, there is no "rule of alternate",
where if 2 is single then 4 is complex or vice versa.
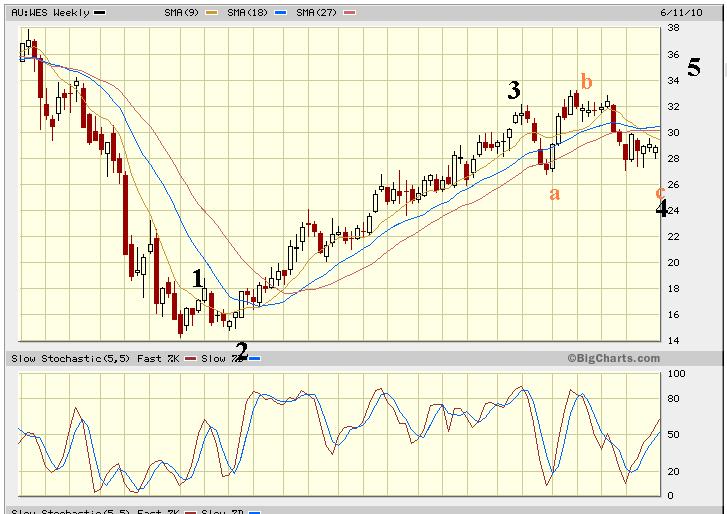

More elaborate elliot daily wave count base on prefered chart. Prices can be seen consolidating in a triangular complex 4th wave. Looking for a minor 5th wave down to complete a major C wave. Then look for an impulse major 5th Wave.
Friday, June 11, 2010
Rio Tinto

Rio Tinto : look to short at around $72.50. Or wait for confirmation at that point. Prices has trace a 5 wave impulsive wave that probably is WAVE A. Wave B in progress. Looking to trade Wave C at about $72 - $73 levels. At that point prices would have retrace 61.8% of Wave A and also at the top of the parallel resistance line.
AXA


On a first glance on the weekly chart prices seems like it may fall back to the support line at $5.00. But on a closer examination of the daily chart, prices have mave made a mini 5 wave and aseemingly 3 wave correction, so it seems more like an more Impulsive move from $5.50 which is also a major support line. Daily stochs seems like suggesting an end of a wave, and weekly stochs at a critical juncture, breakout possible. However prices may consolidate into a triangle with prices ranging between $6.20 and $5.50. Monitor for opportunity to trade on break out. Too early to call.
But on a larger picture...prices may actually stay above support line and reach $8.00. Still pondering how to label the chart.
WBC

Prices in corrective 3 wave move. A & B is completed. If C= A = $3.00. Then prices would reach $25.00. Also the point of resistance triangulation formed by a sloping resistance from $28 levels, and a corrective resistance formed by the consolidation itself at about $25.00. Stochs seems like showing wave still have room to topped.
2 trading opportunity :
1. Trade up to $25.00 from around here.
2. Then turn short from there.
Thursday, June 10, 2010

Subscribe to:
Posts (Atom)