Tuesday, November 30, 2010

Amazon : Head and shoulder above RIMM, Google and Apple

Ref to previous post on "Amazon "as well :
http://tradermarkjournal.blogspot.com/2010/11/amazon-end-of-amazing-run-final-doji.html


Amazon has been rated overvalued by several analyst including this one, Andrew Zacky. Making a fndamental case of way overvaluation of Amazon when comapared to Apple, RIMM and Google. Going so far as in saying, if Amazon stock were to be halved it would still be overvalued and at that time the articles was written AMZN was hovering near $160. Today its $176 with a recent high yesterday of $181.


Is the end in sight ? Gold or Aust properties ?

A contrarian view. Is the end in sight for Gold ? After all George Soros has described it as a bubble back in March 2010. The "Go For Gold" picture above is taken out of pg 32 of Australian Property Investor - Oct 2010 issue. Australian Property Investor is an Australian based magazine dedicated to property.

Ummmm... A dedicated property magazine of Australian properties touting Gold ??

Its like Bill Gates touting Apple's Iphone.

Either it's suggesting investors should be considering getting out of OZ properties for better investment alternative like Gold; or
Gold rises finally cannot be ignored and even a magazine normally dedicated to property succumb finally at the end to acknowledge Gold as a viable alternative investment ? Or to keep its readers happy it cannot not write something about Gold.

Whichever it is, it feels like the writing is on the wall for Gold and we are at the last stage of the bull run. Caveat Emptor.

Monday, November 29, 2010

AudUsd : An Update


Amazon : End of the Amazing Run ? The final Doji Nailed it ??


Amazon is this it ? The end of the final run. The last breath ?? Stochs at extreme high, trading day ended with a Doji right at the resistance line. Only thing in this pretty reversal picture is the price gain with high volume. Although having said that it still is a Doji as compared to a bullish candle bar. High volume could be attruibuted to expiry of Nov option....All in all watch this space for added weakness and thus reversal to $160 then $120 !!

Sunday, November 28, 2010

AudUsd : Another look at the Head and shoulder pattern


Neckline is broken.
Only thing is the stochs is scapping the bottom of O/S
But with 3rd waves stochs sometimes do stay outside the deviation for a while
Going with the Head and Shoulder Reversal.
Target 0.9200

AuDUsd : Trading the Head and shoulder


30 minute chart.
Unless prices trade through without correction and knife thru
0.9620
If not try to sell at higher prices. Considering the alternate corrective rule
if wave 2 and wave 4 alternate between complex and simple correction.
If Wave 2 is simple then wave 4 is complex.

Caltex : Au:CTX

Various Time perspective of Caltex Chart.
Price of objective of $20.
Price projection = Height of the Triangle
$8 on breakout of $12

Monthly Chart : For broad perspective. Need to drill in to smaller
timeframe to trade.


Weekly Chart Price's structure :
5 wave pattern has completed .
Looking for a retracement. 33%


Daily Chart : Price Structure


Saturday, November 27, 2010

TraderMark's Maxim

If Property is about Location, Location, Location
Trading is Timing, Timing, Timing.
And Technical Analysis is its TimeKeeper.

AUDUSD : Head and Shoulder

1st Objective : 0.9337 Distance from break of neckline, distance of Head to neckline

To add a dice of perspective, the same daily AudUsd is inverted.

AMZN : Amazon : 5th of the 5th of the 5th !!!

What is interesting in this AMZN chart besides it has top out 5th of the 5th of the 5th which means an imminent decline is on the way back down to $120. Several analysts have already called the overvaluation in this stock. Read the prevous posts for further insights. But for now, here, it has been said each stocks has its own peculiarities and the same theme runs over and over again. For AMZN - Amazon the online book retailer is its 4th wave correction which has a complex 3 waves correction with the "B" waves higher than the "A", be it in the daily, weekly or monthly chart, be it in the minor wave or the next wave higher in the larger degree. It almost always does the hybrid 3 waves a-b-c correction with the "B" higher than the "A".
MONTHLY CHART
WEEKLY CHART

DAILY CHART

TraderMark's Trading Maxim


I am neither a bull or bear .
I place my bet on either bull or bear
It's always a tug of war between
The bulls and bears
On the side of the stronger I will be.
Player I am not.
Participant I am not.
I just place my bets on the stronger side.

Friday, November 26, 2010

LYC : Lynas

On the whole LYC does look a bit toppish. Will probably call a top at $2.00.
It has fan out from a base of $0.05 [?] and has touched the resistance at $1.80
may retest or make another high at $2.00.

Price-Volume on a whole has been very bullish the past several months.
Only thing is this month with a higher volume it has yet to make a new high.
Although the candle for the month will only complete next week to determine
if its below or higher than previous high.
If below, a bit of consolidation or correction may take place.

Stochs is near extreme over-bought. On a monthly basis.

$1.80 is key level now, to see how prices will negotiate this resistance.
Next level will be the long term resistance line at $2.00.


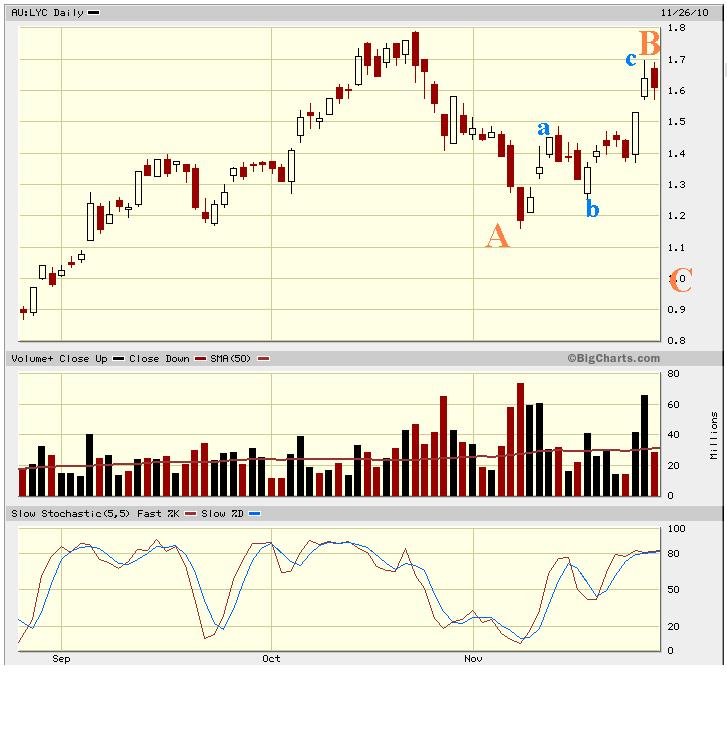
Drilling in abit more to see the weekly price structure, the correction to $1.20 could either
be a
wave "a" - which means prices is nearing completion of wave b and a downward "C' to follow or wave 4 - which means currently wave 5 is in progress which may topped at $2.00


possible scenatio :
Currently a corrective Wave B advance is in progress
and any corporate develpment is already priced in
and Wave C down to follow.

With daily stochs and monthly stochs at extreme or nearing extreme, upside maybe limited
Prefer a play to the down side at current level or higher or at $2.00.


Thursday, November 25, 2010

Singapore Airlines : A great way to fly ??

SIA. Prices has traced a 5 wave uptrend. Anticipating correction back to $14 - $12 level.


On the daily chart front....Prices has already started the descend.
Now is to pick a tine point for a short entry,
As tempted as it is...will wait to see how the 3 waves pattern develop
And sell on a bounce.....

Coca Cola in Africa : last round.

TraderMark's Trading Maxim :Greed & Gambling

Greed is oversizing the position
Greed is over trading the account
Greed is pushing the boundary of technical limits

Greed is instigated by neediness.
Neediness pushed us to want more.

Gambling is depends on luck.
Trading is as much science and art.
A trader's luck is knowledge and understanding
of Technical rules of market behaviour.

A good trader does not depend on luck.
His luck is his skill as a market technician.
A good trader knows his skill and his limitations
And stays within it.
As long as he stays within it and not wonder out
he will be protected from
Greed and fear.

He must know his financial position
and what he realistically can take from the market.
Less is fear
More is greed.

Greed is triggered by his needs and his fantasies
Fear is triggered by his insecurities.

Wednesday, November 24, 2010

AudUsd : Has the "C" wave completed ??


For the previous count to be valid, prices should not go above wave1
Which it has, based on intra-day low but no on close.
Still gunning for a major 5th wave down,
But prices seems to be forming a mini 5th of the C.
looking for a top of the 4th [Sorry 2 should be a 4]

AudUsd : Head & Shoulder : daily chart

Tuesday, November 23, 2010

AudUsd : 2 hourly : 5th ??

Fwd: AudUsd : Head & Shoulder


Subject: AudUsd : Head & Shoulder


In Pda brevity mode.

DIA : Diamond : An update


Further fall expected at least in the near term.
to lower trend line of triangle.
50% fibo sits at 107
Prices currently sitting precariously at support.
A break will send it diving.

Monday, November 22, 2010

DBS Singapore : Trend channel


Prices expected to continue the drive down the trend highway to $13.25.
Prices would have U-turned if it goes above $14.20


Friday, November 19, 2010

AudUsd_4Windows

30 Minute chart : Support       9839
                          Resistance  9902
 
2 hourly and 4 hourly chart : Prices still sitting above the triple moving averages band


Twin movement between AudUSD hourly and daily Chart

Thursday, November 18, 2010

DIAMOND : DIA : Dow Jones


Dow very impessive showing yesterday.
Triple digit gain almost 200pts with string volume.
However still holding to view to is a corrective advance
probably consoildating at or near these levels
with stochs turning up from bottom
probably additional momentum to the upside
which is capped by :
1. Resistance line
2. Moving averages bands
3. Fibo retracement percentages.

Expect a consolidation , maybe a complex, maybe a triange
Before the move down.

DBS : favouring to the downside


Still expectng DBS to trade to to the lower trend line.
This is a weekly chart.
$14 and $15 corridor has been a major contesting ground
between the bulls and bears.
With the bulls defending the $14 even with heavy selling volume.
Bulls and bears are equally matched at the moment.
This week so far has been low on volume.
Showing abit of exhaustion on both side.
Dow has jumped overnight with a triple digit gain.
Seniment should be initially bullish.
As for DBS, favouring a continuation of the downward movement as
has been initiated over the last 4 to 5 weeks.

AudUsd - Corrective advance to re-test 1.00 again ??


AudUsd finishing off the 5th wave of the corrective C wave
A small triangle has formed in the C's 4th wave.
Stochs has bounced off at te major juncture of the corective trend channel.

Tuesday, November 16, 2010

If Wave 4 divides the whole impulse wave by 61.8% Fibo
Then the remainder Wave 5 makes up the 38.2%
Which puts it to 1.5773 to complete the 5 as well as the 5th wave of it.

Mini 5 th wave

FMG : Correction


Prices seems to have topped with the 5th wave peaked out.
Stochastics showing a bearish divergence to price.
Prices traced out a 5 wave elliot.
Looking for retracement to at least 38.2% Fibo at around $6.00
If really bearish maybe to $5.65.

USDJPY : Correction. Current top ??


GBPUSD : "C" wave


Wave "A" took about 10 x 8hr bar.
Presume Wave C take about the same.
That will be about 80 hours
Slightly more than 3 days.
That will be Friday night.

Thursday, November 11, 2010

Fwd: Head & shoulder in the making ??


To: "Tradermark.news" <tradermark.news@gmail.com>
Subject: Head & shoulder in the making ??